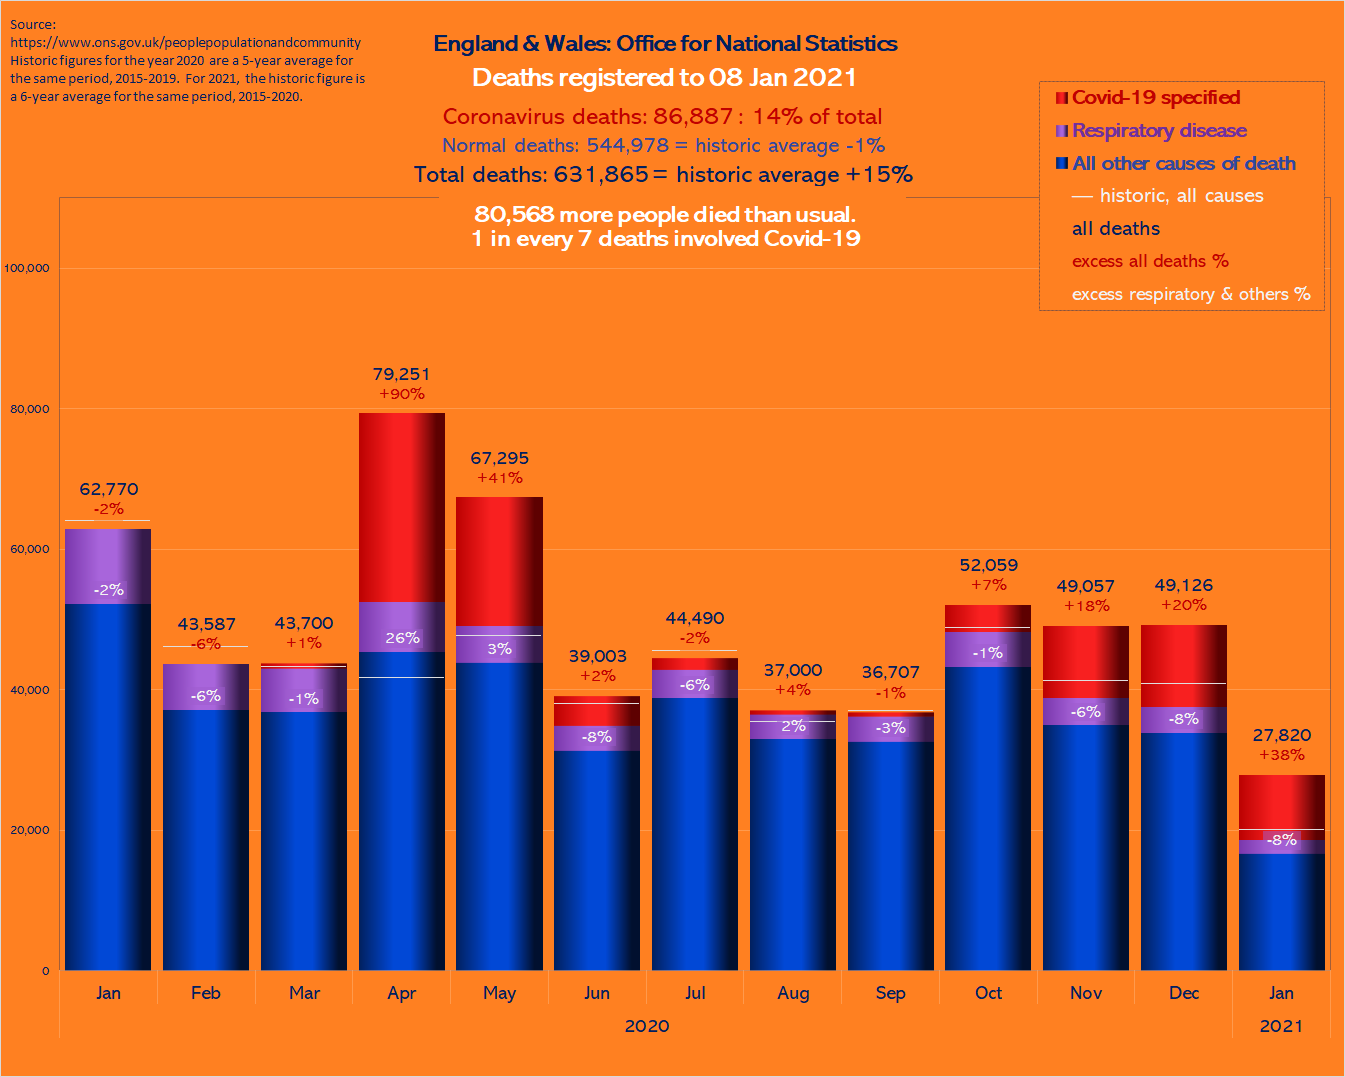
The chart shows deaths in England & Wales from 28 December 2019 to 08 January 2021. 80,568 more people died than usual during this time. 14% of the deaths were due to Covid-19 (86,887). In the first week of Jan 2021 17,751 people died, which is 45% above average for the week.
For every 100 normal deaths, another 14 died
These were not everyday deaths. Normal deaths were down 1%, but the total is 15% above normal. Therefore 114 people died for every 100 who would have died anyway across this whole period. All of them, and more, had tested positive for Covid-19.
In January 2021, it’s 45 extra per 100
The first week of January, 2nd – 8th, saw a reduction of 4% in normal deaths: 520 less than usual. But a further 6,057 deaths involving Covid brought the week’s total to 45% above normal.
Now we’re getting underlying cause data, we can see that fully 30% of the week’s mortalities were specifically due to the coronavirus (5,367). This is almost all the excess deaths (5,537).
Nearly all had Covid as underlying cause
- 5,367 deaths in the week were caused primarily by the coronavirus.
- 1,262 gave respiratory disease as the underlying cause of death.
- 380 deaths were caused by influenza or pneumonia.
“Since 1959, which is when ONS monthly death records began, the number of deaths due to influenza and pneumonia in the first eight months of every year have been lower than the number of COVID-19 deaths seen in 2020.”
Sarah Caul, Head of Mortality Analysis, ONS
Larger view and data [Back up]

England & Wales deaths, 18 Dec 2019 to 08 Jan 2021. Click to enlarge.
| Date | historic, all causes | all deaths | excess all deaths % | excess respiratory & others % | All other causes of death | Respiratory disease | Covid-19 specified |
| 2020 | |||||||
| Jan | 64,179 | 62,770 | -2% | -2% | 52,326 | 10,444 | 0 |
| Feb | 46,283 | 43,587 | -6% | -6% | 37,247 | 6,340 | 0 |
| Mar | 43,406 | 43,700 | 1% | -1% | 36,878 | 6,175 | 647 |
| Apr | 41,780 | 79,251 | 90% | 26% | 45,431 | 7,137 | 26,683 |
| May | 47,816 | 67,295 | 41% | 3% | 43,912 | 5,197 | 18,186 |
| Jun | 38,091 | 39,003 | 2% | -8% | 31,408 | 3,504 | 4,091 |
| Jul | 45,614 | 44,490 | -2% | -6% | 38,845 | 4,042 | 1,603 |
| Aug | 35,585 | 37,000 | 4% | 2% | 33,005 | 3,465 | 530 |
| Sep | 37,129 | 36,707 | -1% | -3% | 32,639 | 3,537 | 531 |
| Oct | 48,881 | 52,059 | 7% | -1% | 43,311 | 4,962 | 3,786 |
| Nov | 41,418 | 49,057 | 18% | -6% | 34,991 | 3,926 | 10,140 |
| Dec | 40,947 | 49,126 | 20% | -8% | 33,913 | 3,724 | 11,489 |
| 2021 | |||||||
| Jan | 20,168 | 27,820 | 38% | -8% | 16,679 | 1,940 | 9,201 |
| Total | 551,297 | 631,865 | 15% | -1% | 480,585 | 64,393 | 86,887 |
Data source: Office for National Statistics

Leave a comment